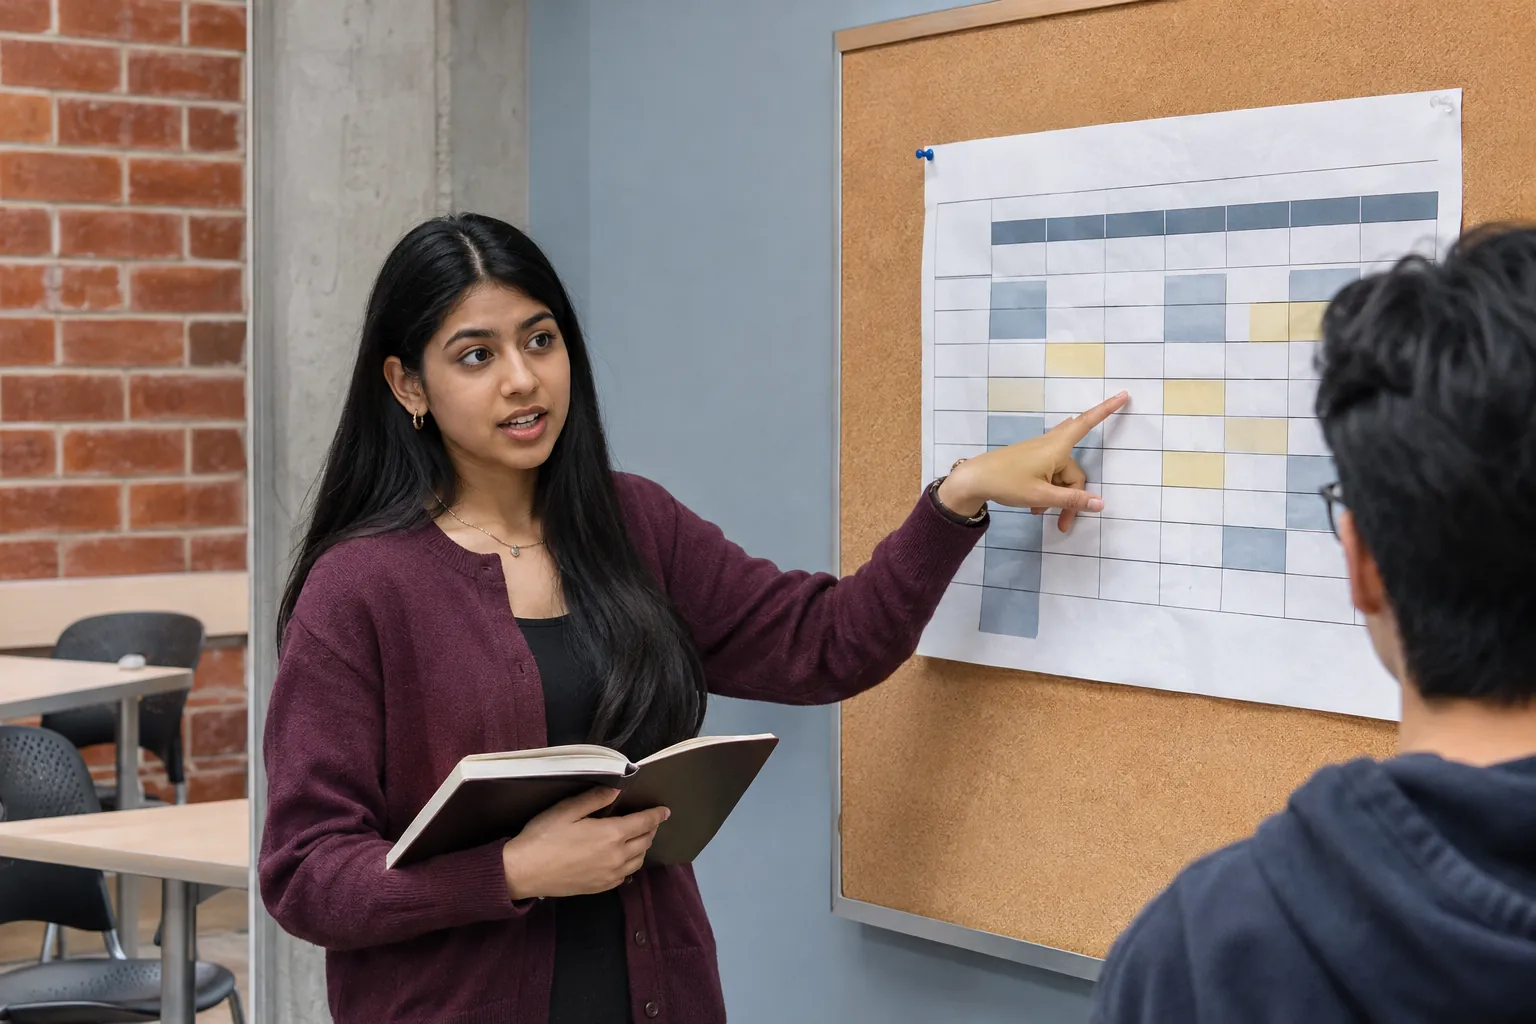
A data science project used short observation windows to explore how shared study rooms are used. The team kept the missing periods visible in its charts rather than presenting a partial sample as a complete account of campus life.
Ask a question the data can answer.
Sofia Rahman’s study-room project began with a familiar campus question: where might a student find a useful place to work? Answering it with evidence required a smaller and more careful question than whether the institute had enough space.
The Data Science exercise uses selected room-occupancy observations. A count describes the use of a room during a particular window; it does not identify the people present. Before making a chart, the team records what was observed, how the fields were defined and which periods were not covered.
That distinction changes the project. The resulting dataset is suitable for examining the sampled windows and trying a method. It is not a complete record of campus activity and cannot be presented as an institute-wide utilization statistic. The limits belong near the beginning of the analysis.
Leave the gaps visible.
A clean-looking chart can conceal missing observations. Rahman keeps those gaps visible rather than joining periods as if someone had been watching continuously. The notebook records the transformations used to prepare the data, including decisions about incomplete or inconsistent entries.
Dr. Marcus Chen’s review focuses on whether another person could follow those decisions. The project folder contains the starting information, the preparation steps and the chart output. A change in a cleaning rule should be something a reviewer can locate and repeat.
The visualization stage asks a different set of questions. Which comparison matters? Is a difference large enough to interpret given the sample? Does the chart suggest precision that the observation method cannot support? Students use labels and explanatory text to keep the display connected to the evidence.
Compare before adding complexity.
The team is examining a basic forecasting approach alongside a simple baseline. A more elaborate model is not treated as an improvement merely because it produces another line on the chart. Students compare errors and consider which conditions the data represent poorly.
This work brings together Data Preparation, visualization and the later modeling sequence. It also makes a practical case for responsible data practice: a modest, reproducible analysis with clear boundaries can be more useful than a broad claim built on a partial sample.
The immediate output is a notebook and a visual explanation, not a live campus service. The project’s next step is to refine the comparison and document what additional observations would be needed to answer a wider question. Keeping that distinction visible is part of the technical work.